Technology · How it works
The traffic jam with no cars: how 99 phones in a handcart turned Google Maps red
In 2020 an artist pulled a handcart of 99 phones down a street and Google Maps showed a jam. The stunt is a neat lesson in where the red lines come from.
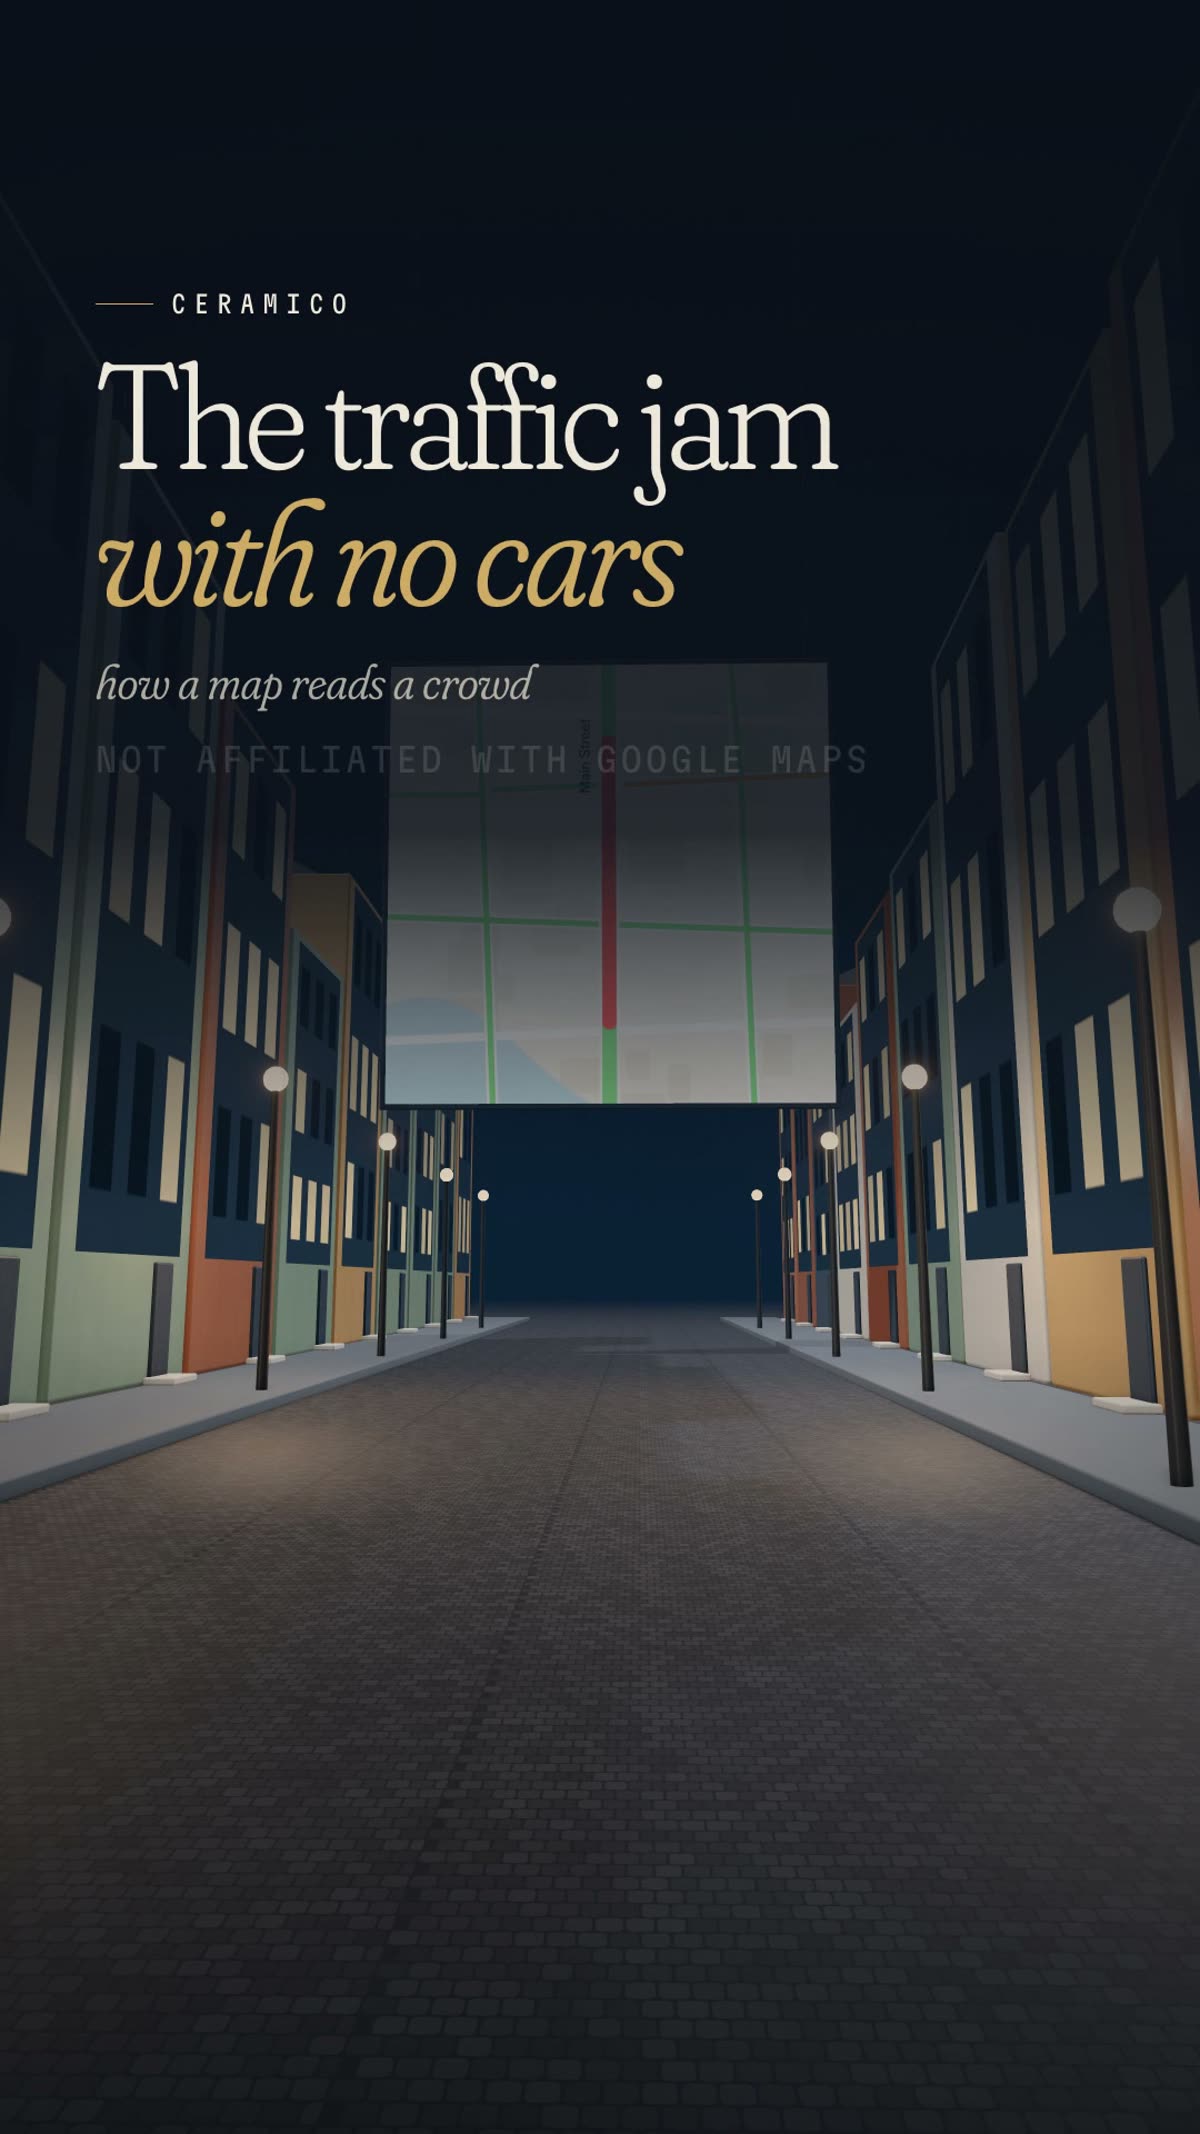 Watch the film · 1:06
The street was empty. On the map, it was solid red.
In 2020, the Berlin artist Simon Weckert loaded a small handcart with smartphones and walked it down the road. His own page for the piece, Google Maps Hacks, describes it plainly: “99 second hand smartphones are transported in a handcart to generate virtual traffic jam in Google Maps.” The result, by his account, was a street that turned from green to red on the map, with no cars causing it.
It is a funny image and a sharp one. Weckert’s point, as he put it, was that “it is possible to turn a green street red,” and that this has an impact in the physical world, because a red street steers navigating drivers onto other routes. But the stunt is also a remarkably clear demonstration of where those red lines come from. To see why it worked, you have to look at what the map is actually listening to.
By the numbers
- Phones in the handcart
- 99 second-hand smartphones
- Year of the artwork
- 2020
- Green on the map
- No traffic delays
- Orange on the map
- Medium amount of traffic
- Red on the map
- Traffic delays
- Google’s freeway example, 6 to 7 am
- 65 mph
- Same freeway, late afternoon
- 15 to 20 mph
The 99 phones are the artist’s own figure. Color meanings are from Google Maps Help. The speed example is Google’s, for the 280 freeway in Northern California, from a 2020 Google blog post.
Where the red comes from
Google laid out the basic idea in 2009, in a post on its official blog about crowdsourcing road congestion. If you used Google Maps on your phone with location turned on, the post said, your phone sent anonymous bits of data back to Google describing how fast you were moving.
One phone on its own is not much use. Google was candid about that: “your one traffic report from your one spot on the road might not help much anyway.” So it combined each phone’s speed with the speeds of other phones on the road. And when many people were reporting from the same area, the post said, Google combined their data “to make it hard to tell one phone from another,” a privacy measure built into the blending itself.
The wording has changed since, but the principle has not. In 2020, Google said that traffic data in Google Maps comes from “a variety of sources,” including aggregated anonymized data from people who have location services turned on and contributions from the Google Maps community. Phones are not the only input. They are, though, the input Weckert chose to fool.
The film · 1:06
The Traffic Jam With No Cars
A clay figure pulls a handcart heaped with 99 phones down an empty street, and the map above turns that street red.
Watch more on Instagram Follow CERAMICO
Read the transcript
An artist once made a Google Maps traffic jam with no cars. The map turned a green street red. But the jam was only on the screen. To see how, you have to know where the red comes from. Google has said phones running its Maps app, with location on, report how fast they're moving. One phone alone might not help much, so Google combines it with others. It said that blending also makes it hard to tell one phone from another. Phones moving freely keep a road green. Slower ones turn it orange, then red. Google says it predicts by mixing live traffic with each road's usual pattern at that time. So the artist piled 99 phones into a handcart, and pulled it down the street. To the map, 99 slow phones bunched together looked like heavy traffic. The map did what it was built to do: it trusted the crowd. 99 phones, one handcart, and a traffic jam with no cars.
Animated model, illustrative and not to scale.
Green, orange, red, and the usual morning
On the map, all of that becomes color. Google Maps Help says the color code shows the speed of traffic on the road. Green means “No traffic delays.” Orange means a medium amount of traffic. Red means traffic delays, and the darker the red, the slower the traffic.
Notice that the scale is about delay, not raw speed. A phone moving at a gentle pace on a quiet side street can leave that street green, while the same pace on a motorway is a serious hold-up. So in our film, phones moving freely keep a road green, and slower ones turn it orange, then red.
Live data is only half of it. To predict how a trip will go, Google says it also studies how each road usually behaves. In a 2020 explainer, the company described analyzing historical traffic patterns for roads over time, then combining that database with live conditions, using machine learning to generate predictions from both. Its example was the 280 freeway in Northern California, where vehicles typically travel at 65 mph between 6 and 7 in the morning, but only at 15 to 20 mph in the late afternoon.
The handcart, up close
Now put Weckert’s cart back on the street. Ninety-nine phones, bunched together, all moving at walking pace along one stretch of road. To a system that reads slow phones as slow traffic, that is a jam.
To a system that reads slow phones as slow traffic, that is a jam.
The details, as Weckert described them to the Frankfurter Allgemeine and as 9to5Google reported, show how specifically he had to play to the system. Each of the 99 borrowed phones had its own active SIM card, and each had Google Maps navigation running. Standing still did nothing: if he stopped, Google Maps was not affected, so movement was always needed. He often had to take the cart up and down the same street. And when another vehicle using Maps drove past, the system recognized there was no jam and set the street back to normal.
We should be clear about what is and is not established. The evidence is the artist’s own page and video, his interview as relayed by 9to5Google, and Google’s response. We found no independent replication. Before Google replied, 9to5Google itself wrote that it was entirely possible the stunt was faked. When Google did reply, it did not deny it.
Trusting the crowd
Google’s statement, printed in full by 9to5Google, was good-humored: “Whether via car or cart or camel, we love seeing creative uses of Google Maps as it helps us make maps work better over time.” It added that it had launched the ability to distinguish between cars and motorcycles in several countries, including India, Indonesia and Egypt, “though we haven’t quite cracked traveling by wagon.”
Was the map broken? That depends on what you think it was for. Weckert titled the piece Hacks, and Google conceded the wagon gap. But the map also did exactly what Google designed it to do. Back in 2009, Google described the approach in a single word, crowdsourcing, and argued that “the more people that participate, the better the resulting traffic reports get for everybody.” The map trusted the crowd. Weckert simply brought his own.
That is the quiet lesson in the cart. The red line on your screen is not a camera looking at the road. It is an inference, drawn from the speed of the phones on it, blended with what that road usually does at that time of day. Ninety-nine phones, one handcart, and a traffic jam with no cars is what it looks like when someone, briefly and deliberately, feeds that inference a crowd it was never meant to see.
Sources
Every line in the film was checked against these sources by an independent fact-checker before publication. Company claims are attributed to the company that made them.
- Simon Weckert: Google Maps Hacks (2020)
- 9to5Google: Google Maps ‘hack’ uses 99 smartphones to create virtual traffic jams
- Official Google Blog: The bright side of sitting in traffic (2009)
- Google: Google Maps 101, how AI helps predict traffic and determine routes (2020)
- Google Maps Help: Use layers to find places, traffic, terrain, biking and transit
Updates and corrections
- First published.
See an error? Tell us. We correct promptly and say what changed. Our corrections policy.
Disclosure
This is an independent explainer. CERAMICO is not affiliated with, sponsored by, or speaking for any company, brand, agency or person named in this story, and nothing here is official.
Claims are attributed. Where a figure or description comes from a company or an expert, we say so. CERAMICO is not affiliated with, or endorsed by, Google. Brand names identify the product only. Simon Weckert’s artwork is described from his own page and press reports. The animation is an illustrative model, not to scale.
Animations are illustrative. Our films use clay-style 3D models. They are not to scale and are simplified to show how something works.
Trademarks and product names belong to their owners and are used only to identify what we are describing.
Keep reading
The penalty for turning left: how UPS taught its routing software to put a price on risk
UPS trucks are famous for not turning left. The truth is subtler: UPS built software that makes a left cost more, then lets the math decide.

The loom that stopped itself: how a weaving machine gave Toyota its andon cord
Toyota lets any line worker call a stop. The reason goes back to a carpenter’s son, a snapped thread, and a loom built to notice when something went wrong.

The Dreamliner’s missing window shade is a chemical reaction you switch on
There is no blind at a 787 window seat, only a button. Behind it sits a thin gel that turns dark when a small voltage moves its electrons, and clears again the moment the power stops.